A Simple 3-Step Approach to CGM Data Interpretation
Continuous glucose monitoring (CGM) usage is increasing for all types of people living with diabetes. When considering potential shortages and disparate access to endocrinologists1, primary care providers may be increasingly relied on to interpret CGM data and use it to inform treatment decisions.
To help address these needs, Emily D. Szmuilowicz, MD, and Grazia Aleppo, MD developed a simple, 3-step approach2 to efficiently interpret and utilize data from CGM systems like Dexcom G6.
Before Starting: Is There Enough Data to Analyze?
The Ambulatory Glucose Profile (AGP) report from Dexcom Clarity will tell you the percentage of time the CGM device is active. The internal consensus on time in range (TIR) recommends at least 70% of data should be captured from 14 days of sensor wear.3
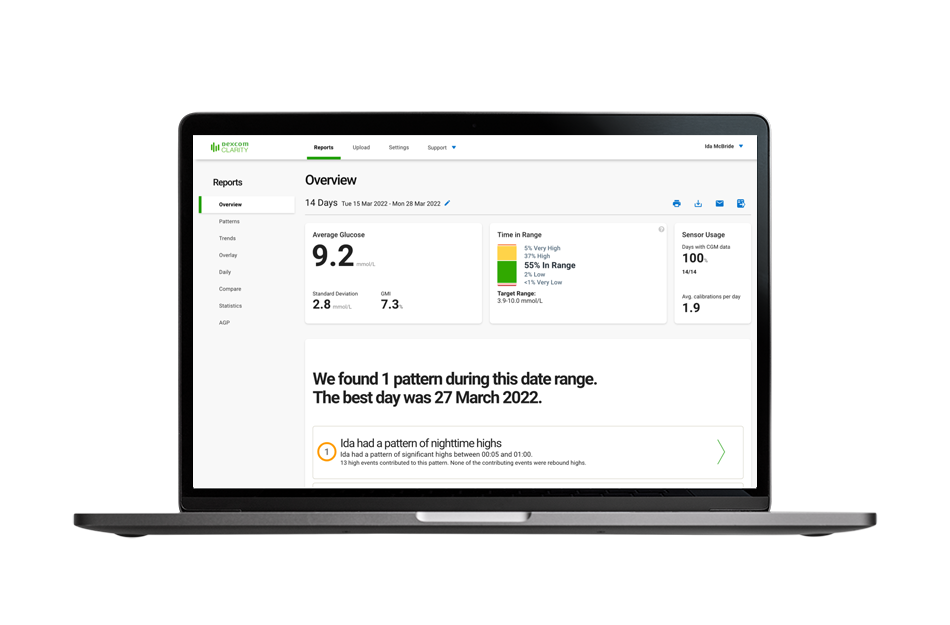
Step 1: What is the Problem?
The first step is to define the problem. Is it hypoglycemia, hyperglycemia, or both? Are time in range goals being met? These answers can all be found in the CGM metrics.
Step 2: Where is the Problem?
The second step is to analyze the AGP report to determine whether a pattern exists and, if so, where it exists.
The AGP report is a summary of glucose values from the reporting period that allows you to visually pinpoint the time(s) of day when patterns take place. Knowing the person’s typical mealtimes, sleep schedule, and exercise routine can help determine potential triggers for hypoglycemia and hyperglycemia. For example, does the problem occur with fasting or is it postprandial?
Always address hypoglycemia first. Look for times of day when the lowest percentile curve displayed (5–10th percentile curve) falls below 3.9 mmol/L.
Next, address hyperglycemia. Look for times of day when the 75th percentile crosses the upper end of the target range (10.0 mmol/L). The goal for adults is to have less than 25% time above range (TAR).3
Step 3: How to Adjust the Therapy?
Finally, review the daily glucose data at the bottom of the AGP report. Assess the patterns and the effect of medication doses, medication timing, and impactful behaviors, like exercise or alcohol consumption.
Once patterns are identified, the 3-step approach recommends detailed therapy interventions for hypoglycemia and hyperglycemia in people living with T2D. These modifications can be found in our PDF summary.
Quick Tips For Success
Follow these tips to make the 3-step approach as effective as possible:
- Address hypoglycemia first.
- If no hypoglycemia, assess fasting and/or postprandial hyperglycemia.
- Focus on one therapeutic change per visit.
- Engage the person living with diabetes in shared decision-making.
Through data-sharing platforms like Dexcom Clarity, healthcare providers can access a person’s glucose data at any time and easily put these three steps into action. And don’t forget — working together with the individual is key to understanding the data and improving their diabetes management.
Download A Stepwise Approach to CGM Interpretation PDF
1 Lu H et al. BMC Health Serv Res. 2015;15:54.
2 Szmuilowicz E, Aleppo G. Stepwise approach to continuous glucose monitoring interpretation for internists and family physicians. Postgraduate Medicine. 2022 Nov;134(8):743-751.
3 Battelino T et al. Diabetes Care. 2019;42(8):1593-1603.
MAT-0067 V1.0